A weekly streaming chart and a most-popular chart answer different questions
Two ranking headlines can both be accurate while describing different periods. A weekly chart concerns a defined week; Netflix’s most-popular lists use a first 91-day window. Read the time frame before comparing positions, or a title’s absence from one list can appear to contradict its presence on another.
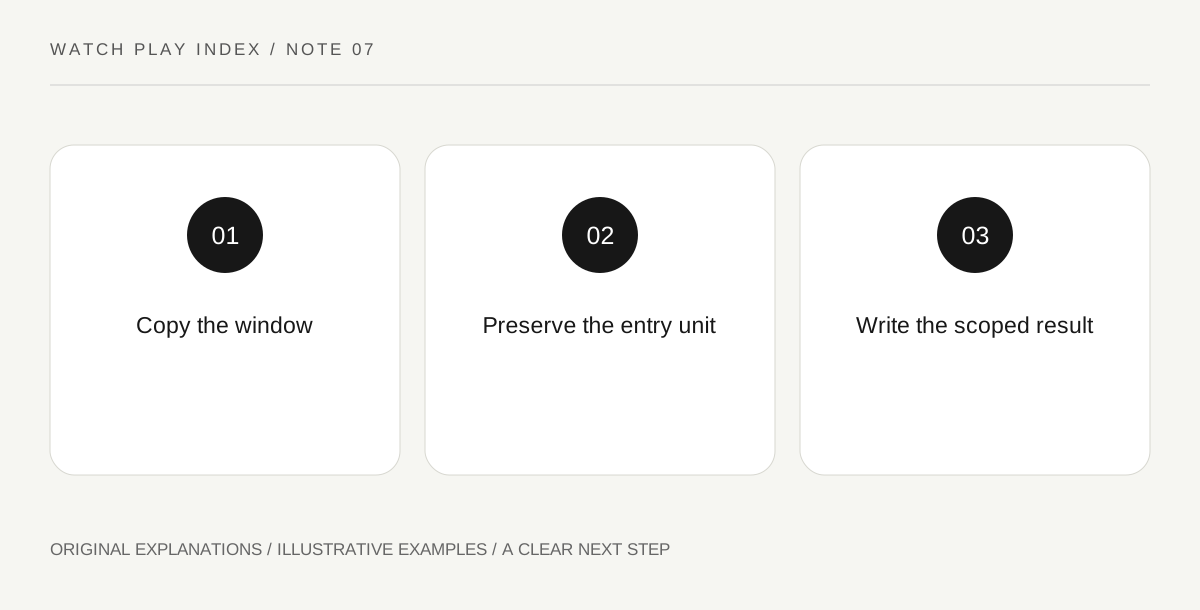
Original explanatory diagram. Read the full method and limitations below.
Read the chart’s date label first
The weekly Tudum chart displays a particular date range, while the most-popular page explains its first 91-day ranking basis. Copy that window before copying the rank. A screenshot with its date cropped away loses information needed to interpret the result. Include the geographic and title category as well. A global film list, a television-season list and a country chart are different comparison groups even when their headings all contain the same Top 10 phrase.
Describe the question each list answers
For an invented example, a weekly list might show which titles accumulated the relevant metric during one recent week. A first 91-day list compares the defined early-release window. Neither should be casually renamed a measure of everything ever watched. Say what the published list actually measures. This keeps an older successful release from being described as unsuccessful simply because it is not in the current week’s ten entries, or a short current surge from becoming an unsupported historical record.
Keep the entry unit intact
A television ranking may identify a particular season, not the entire franchise. Record that season in the note. Do not sum several entries or replace a season name with a show-wide total unless you have a defined, valid method and the relevant data. The same care applies to language and region categories. Comparing ranks only makes sense when the groups and units are understood; a number one position in a smaller defined list is not a universal league table.
Write a scoped summary
Use a sentence with the title or season, rank, list category and window. If the data is a saved snapshot, state its date rather than implying live access. A reader should be able to reconstruct the question without opening your original screen. When a new chart appears, it creates a new observation; it does not make the earlier dated observation false. Retaining that history is more useful than overwriting a note with a sequence of context-free ranks.
An illustrative reader exercise
Imagine a fictional season ranking first in one weekly category but absent from a first 91-day most-popular list. The two observations need not conflict because they ask different questions. A careful reader saves both scopes instead of calling one chart wrong. This scenario uses no real ranking and offers no current recommendation; it illustrates how the period and entry unit change the interpretation.
Questions that come up
Does most popular mean unlimited lifetime viewing?
Read the stated methodology. Netflix’s cited page uses the first 91days for this list, so calling it every viewing hour across an unlimited lifetime would change the definition.
Does absence from a weekly Top 10 establish low total popularity?
No. It only describes absence from that defined list for that period and category. It cannot by itself establish a title’s overall audience, reception or success under another metric.
References and scope
These sources support the factual background. Examples and exercises are original illustrative teaching material. References do not imply endorsement.
- Netflix Tudum — weekly Top 10 — Dated weekly ranking, scope, views, runtime and hours columns.
- Netflix Tudum — most popular shows — First 91-day ranking window and separate season entries.